How To Read Single Candlestick Patterns?
How To Read Single Candlestick Patterns?
what is candlestick pattern in trading and investing world?
In the 18th century a wealthy Japanese businessman, Munehisa Homma developed a technical analysis method to analyze the price of rice contracts. Today this technique is called candlestick charting and is widely used when drawing stock charts. Homma, from Sakata, Japan began trading at the local rice exchange around 1750. He kept records of the market psychology learning to boost his profits by carefully monitoring prices and not to rushing into trades.Homma is regarded as the Grandfather of candlesticks because of his research on price pattern recognition. Homma is credited with giving rise to a research technique which became the basis for trading in Japan.
Candlestick charts use the same price data as bar charts (open, high, low, close). However, candlestick charts are drawn in a much more visually identifiable way typically resembling a candle with wicks on both ends. The high and low are described as shadows and plotted as a single line.
Learning how to read candlestick charts is easy. The price range between the open and close is plotted as a rectangle on the single line called as Real body. If the close is above the open, the body of the rectangle is Green. If the close of the day is below the open, the body of the rectangle is red.
Steve Nison,Father of candlesticks and author of popular candlestick charting books such as Strategies for Profiting with Japanese Candlestick Charts and Beyond Candlesticks: New Japanese Charting Techniques Revealed is widely credited with bringing candlestick charting to the Western world from Japan in 1989 when he published his first article on candlestick analysis in Futures magazine.
Single candlestick patterns
This is one day SBI chart this is the shape of candle occurs at the end of the day. This candle is a result of various price movements throughout day as you can see in line chart.
To understand the process of forming candle can be seen
* Price open at certain price level.
* It drops at certain price which is days low.
* Price riches at some price point where prices are at days high.
* prices drops from top price point and at the end of the day market closed. The price at which market closed is closing price.
if you want see more about formation of single candlestick you should check this following video
1. Big White Candle
Big White (Green) Candle has an unusually long white body with a wide range between high and low of the day. Prices open near the low and close near the high. Considered a bullish pattern.
2. Big Black Candle
Big Black (Red) Candle has an unusually long black body with a wide range between high and low. Prices open near the high and close near the low. Considered a bearish pattern.
3.White Body Candle
4.Black Body Candle
5.Doji Candle
Doji Formed when opening and closing prices are virtually the same. The lengths of shadows can vary. Indicates indecision in market.
6.Dragonfly Doji Candle
Dragonfly Doji Formed when the opening and the closing prices are at the highest of the day. If it has a longer lower shadow it signals a more bullish trend. When appearing at market bottoms it is considered to be a reversal signal.
7.Gravestone Doji Candle
Gravestone Doji Formed when the opening and closing prices are at the lowest of the day. If it has a longer upper shadow it signals a bearish trend. When it appears at market top it is considered a reversal signal.
8.Long-Legged Doji Candle
9.Hanging Man Candle
10.Hammer Candle
Hammer A Green or a Red candlestick that consists of a small body near the high with a little or no upper shadow and a long lower tail. Considered a bullish pattern during a downtrend.
11.Inverted Hammer Candle
12.Long Lower Shadow Candle
13.Long Upper Shadow Candle
Long Upper Shadow A Green or a Red candlestick with an upper shadow that has a length of 2/3 or more of the total range of the candlestick. Normally considered a bearish signal when it appears around price resistance levels.
14.Marubozu Candle
Marubozu A long or a normal candlestick (A Green or Red) with no shadow or tail. The high and the lows represent the opening and the closing prices. Considered a continuation pattern.
15.Shooting Star Candle
Shooting Star A Green or a Red candlestick that has a small body, a long upper shadow and a little or no lower tail. Considered a bearish pattern in an uptrend.
16.Spinning Top Candle
Spinning Top A Green or a Red candlestick with a small body. The size of shadows can vary. Interpreted as a neutral pattern but gains importance when it is part of other formations.
17.Shaven Bottom Candle
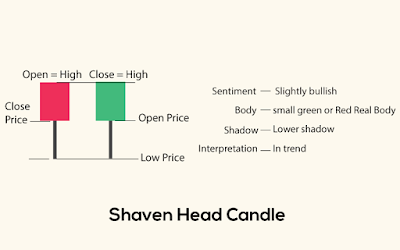
18.Shaven Head Candle
Shaven Head A Green or a Red candlestick with no upper tail. [Compare with Hammer].
Please subscribe to our youtube channel for more interesting educational stuff.


Leave a Comment